Wavelength Reflectance and Vegetation Indices. Precision agriculture’s focus on getting the absolute most out of the land year after year gives farmers a strong interest in the progress of commercial UAVs. By using specialized cameras farmers will be able to see their farms from above, observe exactly where their problem sections are by using vegetation indices, and program their variable rate machinery to treat these sections directly. UAVs can help in the process of producing maps like this one at highly accurate resolutions for a low cost and with a short turnaround time:


(Stockdale, 2014)
The above image is an angularly and geographically accurate map of a 1.5 hectare field in Claremont, CA. It was constructed using the SFM process mentioned above, but then modified to show relationships in the reflective properties of plants in certain wavelengths. These reflective properties show how healthy the plant is based on how light passes through or redirects back. In this case the closer the color is to ‘+1’ on the included scale, the healthier the section is. When ‘ground truthing’, or checking to see if real life results are accurately captured in the image, we found that this image shows an extremely accurate representation of the health of the field.
In order to produce images like this, we manipulate light wavelengths and use the reflectance of the plants being surveyed. This means that we need to pull Near Infrared, Red, Green, and Blue wavelengths apart and use them to determine plant health (Lebourgeois, Bégué, Labbé, Mallavan, & Prévost 2010).
Agronomic studies have been carried out on this process and its benefit for the past forty years. The technology and theory rest on the fact that healthy plants with strong photosynthesizing cells reflect almost all infrared and green light – while absorbing most red, blue and yellow light as energy. Unhealthy plants have weaker cells that allow infrared light to pass through them. Additionally, they do not take in as much red, blue and yellow light, and instead reflect it back. So, we can manipulate the images by taking the wavelength strength and comparing it to other wavelength’s magnitudes.
As collected by Pinter:
“Green plant leaves typically display very low reflectance and transmittance in visible regions of the spectrum (i.e., 400 to 700 nm or Blue, Green, and Red) due to strong absorptance by photosynthetic and accessory plant pigments (Chappelle et al., 1992). By contrast, reflectance and transmittance are both usually high in the near-infrared regions (Near Infrared, 700 to 1300 nm) because there is very little absorptance by subcellular particles or pigments and also because there is considerable scattering at mesophyll cell wall interfaces (Gausman, 1974; Gausman, 1977; Slaton et al., 2001). This sharp dissimilarity in reflectance properties between visible and Near Infrared wavelengths underpins a majority of remote approaches for monitoring and managing crop and natural vegetation communities (Knipling, 1970; Bauer, 1975).”
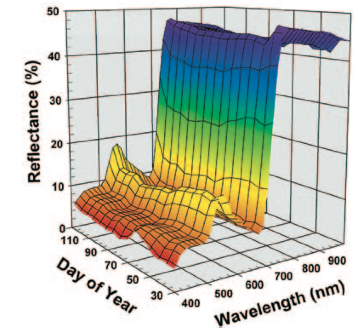
These observations reinforce the idea that the reflectance of different wavelengths do in fact represent qualities of plants like chlorophyll concentration – which is responsible for the photosynthesis in plant cells. Plants that are under stress from a pest or weed will have lower chlorophyll levels, photosynthesize less, and absorb less red, blue and yellow light – instead reflecting those wavelengths back.
As a visual example, the image below shows the reflectance of a particular healthy section of vegetation. We can see that lower wavelengths (blue, green, red) reflect back much less than higher wavelengths (Near Infrared). We can also see that the reflective properties change over the course of this 120 day growing cycle and the plant naturally grows and dies:
 (Pinter et al., 2003)
With this in mind, we can then begin to think about how we can turn a plant’s reflective properties that represent health into quantitative measurements of how a certain section of the field is behaving. Spectral Vegetation Indices provide us a good option for collecting these measurements.
Vegetation Indices. Vegetation indices are ratios or linear combinations of reflectance in Green, Blue, Red, and Near Infrared (NIR) wavelengths (Moran, M.S., Inoue, & Barnes, 1997). For example, a vegetation index might be:
Near Infrared(NIR) – Green
This index gives us a measure of the NIR reflectance minus Green reflectance – or a measure to quantitatively assess the health of the section (McKinnon, 2012). Conceptually: we know a healthy plant is absorbing red, blue, and yellow light, and reflecting back green light. Healthy plants also reflect back almost all near infrared light – so by taking the magnitude of the total light being reflected back (NIR) and subtracting the magnitude of the green light being reflected back we can get a measure of how much total green light is being reflected back relative to the reflectance of all light reflecting back from the plant. The resulting value gives us an accurate measure of how healthy a plant is based on the amount of green light it is reflecting, and how much red, blue, and yellow light it is absorbing.
Other vegetation indices, like the Normalized Difference Vegetation Index (NDVI), will use a slightly different approach. Instead of just this first step, NDVI also requires that we divide this first index by NIR + Green, so our final equation looks like:
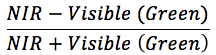
Both of these indices will give us a ratio that we can use to determine the health of a plant or section – but do so in different ways. Depending on the lighting, the time of year, the type of crop, or other factors, one might choose to use one vegetation index over another – but all give the same output: a decimal number representing the health of the plant surveyed (Lebourgeois, 2010). Vegetation indices like these and others are used when management goals require quantitative measurements of biomass, leaf area index, growth patterns, and section health. Vegetation Indices have a high correlation with green biomass and leaf area index of crop canopies (Pinter, 2003).
Types of Mapping Cameras. The sensors used on both satellites and planes are large multispectral sensors. These sensors can break our visible wavelengths into much smaller wavelengths to get specific colors. These colors can then be manipulated to show us new information, like in the case of NDVI showing us the health of farm field sections. These cameras also cost hundreds of thousands of dollars and weigh much more than a small UAV can carry.
A new solution is needed to detect these wavelengths if we are going to use UAVs to capture this type of data. Weight and flight time (and consequent area covered) are directly correlated – meaning that every gram onboard needs to be optimized to the application. Lifting a large sensor would mean a plummeting flight time, and the inclusion of many unnecessary parts. Modern UAV mapping has moved from these large sensors to modified digital cameras. These cameras are usually light point and shoot cameras, modified to see Near Infrared, with 4-5mm focal lengths and 12-16 megapixel resolution. This modification is done by simply removing the Infrared filter in the camera that usually helps to mimic our vision in the camera’s vision (Verhoeven, 2013). Now the camera will see Near Infrared instead of the normal Red/Green/Blue wavelengths our human eyes see.
NIR images can be captured, matched, and processed with Red/Green/Blue images to show us vegetation indices – but this process requires two flights: one for the NIR camera, and one for the Red/Green/Blue camera. Thankfully, recent advancements have led to a new process that requires only one flight and one modified camera to find vegetation indices. This modification is to simply remove the Infrared filter and include a filter that blocks red wavelengths. So now the camera receives NIR/Green/Blue. Now we can proceed just as before using Green and NIR to show us plant health. Cameras like this are fully capable of vegetation mapping on these platforms, weigh around 200g, and cost roughly three hundred dollars. But are they comparable to the top of the line multispectral sensors found on satellites and advanced remote sensing aircraft for agricultural applications?
Lebourgeois and other authors found that modified point and shoot cameras could indeed be used for agricultural remote sensing. In their words: “Putting together several known solutions for radiometric corrections, we showed that a comprehensive image processing workflow was possible for real time crop monitoring using commercial digital cameras” (Lebourgeois, 2010). Their experiment used three modified consumer digital cameras to take aerial images. Then, researchers on the ground examined the plots for Leaf Area Index(LAI), Leaf Greenness(SPAD), and Chlorophyll Content(CC) – three tests for plant health (Lebourgeois, 2010). The ground tests and aerial images were compared for accuracy. The findings showed that modified digital cameras could produce results with sufficient accuracy for crop monitoring by correctly assigning higher vegetation index numbers to plants that were proven to be healthier with the ground testing methods.
References:
Brisco , R.J. Brown , T. Hirose , H. McNairn , K. Staenz. “Precision Agriculture and the Role of Remote Sensing: A Review”Canadian Journal of Remote Sensing Vol. 24, Iss. 3, 1998
Lebourgeois, A. Bégué, S. Labbé, B. Mallavan, L. Prévost, et al.. “Can commercial digital cameras be used as multispecteral sensors? A crop monitoring test.” Sensors Journal, 2008, p.7300 – 7322. <10.3390/s8117300>. <hal-00464025>
Chappelle, E.W., M.S. Kim, and J.E. McMurtrey, 1992. Ratio analysis of reflectance spectra (RARS) – An algorithm for the re- mote estimation of the concentrations of chlorophyll-a, chlorophyll-b, and carotenoids in soybean leaves, Remote Sensing of Environment, 39(3):239–247.
Geert Verhoeven, Corsi, Cristina, Christopher Sevara, Wilfried Karel, Camillo Ressi, Michael Doneus, and Christian Briese. “Undistorting the Past: New Techniques for Orthorectification of Archaeological Aerial Frame Imagery.” Good Practice in Archaeological Diagnostics: Non-invasive Survey of Complex Archaeological Sites. Springer: Springer International, 2013. 31-61. Print.
Pinter, Paul J. Jr.; Hatfield, Jerry L.; Schepers, James S.; Barnes, Edward M.; Moran, M. Susan; Daughtry, Craig S. T.; and Upchurch, Dan R., “Remote Sensing for Crop Management” (2003). Publications from USDA-ARS / UNL Faculty. Paper 1372. http://digitalcommons.unl.edu/usdaarsfacpub/1372